2017 Datasets and Descriptions
Training Data
To develop a model to predict seed variety performance for the class of 2014, you will be provided with yield data from testing experiments associated with the classes of 2011, 2012, and 2013. We are also including data from testing where experimental varieties have the same genetic parents.
Geographic Data
The performance dataset contains yield information for thousands of varieties in hundreds of locations over multiple years. Each trial is linked to its corresponding geographic location. Geographic information is aligned with soil and weather information, and can easily be matched with a more diverse set of factors, from climatic to economic.
Genotypic Data
Elite lines in commercialization are often used as parents to generate new offspring through genetic recombination. Genetic recombination results from the exchange of genetic material either between multiple chromosomes or between different regions of the same chromosome, and generates genetic variation in the second generation, or F2 (Figure 2). These offspring form the starting point for the selection process described in Figure 1.
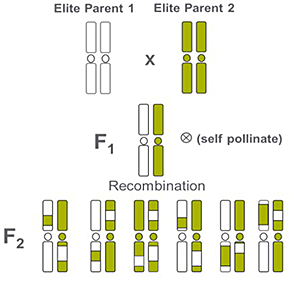
Figure 2. Representation of the exchange of genetic material after crossing two elite parents. The progeny in the first generation present the same genetic composition, while the second generation presents genetic variation providing individuals with faborable andunfaborable characteristics.
The genetic information of parents and offspring can be characterized by single nucleotide polymorphisms (SNP). An SNP is a single base-pair difference in the DNA sequence of individual members of the offspring (Figure 3). The genetic marker information is very valuable for breeding programs because it allows the selection of individual offspring with favorable genes. The data will provide genetic marker information for about 10% of the varieties listed in the challenge.
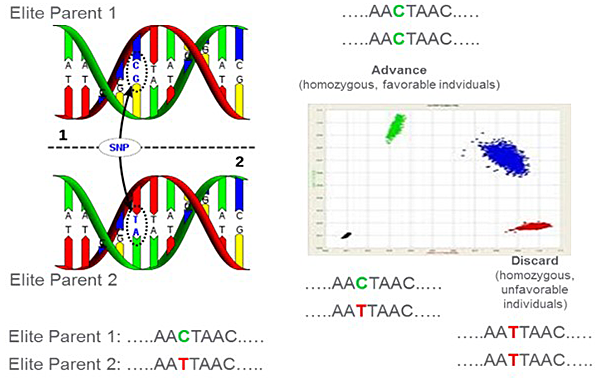
Figure 3. Representation of how an SNP characterizes the genetic composition of parents and offspring after recombination. Parent 1 contains nucleotides C and G, while Parent 2 contains A and T. The offspring show different nucleotide combinations. Marker analysis characterizes the genetic makeup.
Data Description
To address the challenge we will be providing three datasets containing performance, genetic and geographic information:
PERFORMANCE INFORMATION
EXPERIMENT – Experimental varieties of similar relative maturity are tested together in experiments. In the first year of yield testing, experiments often contain closely related experimental varieties, with the goal of selecting the best representatives of a family. In the second and third year of testing, varieties from different families are tested together to determine which varieties will be advanced to the next year or commercialized. In addition to the experimental varieties, designated “check” varieties are contained in the experiments for comparison.
YEAR – Year in which an experiment was conducted.
LOCATION – Experiments are grown at many locations, depending on the stage of testing. Individual varieties may respond differently to different sets of environmental conditions. One of the reasons that varieties are tested over multiple years is to see how varieties will respond to a larger population of environments. For the purpose of this challenge, we are assuming that the yield trial locations are representative of the market that the varieties will be sold in.
VARIETY – The designation of the individual variety that is being evaluated in the experiment. From a botanical perspective, a variety is group of soybean plants that are genetically identical. They are selected for characteristics that are desirable to a grower. The seeds harvested from a soybean variety will be genetically the identical from one generation to the next.
FAMILY – Identifies the “breeding population” from which a variety was derived. Members of a breeding population are highly related to each other since they are derived from the same parents. Many representatives from a breeding population are typically tested together every year with the goal of selecting the best representative of the population.
CHECK – Commercial soybean varieties that are used as performance benchmarks in yield trials. Check varieties are typically elite commercial varieties that are used as benchmarks to measure experimental variety performance. Since the check varieties are already being sold, an experimental variety needs to outperform the check varieties to be considered to move to the next stage of testing. After an experimental variety graduates to commercial, it may become a check in the following years.
RM – Soybean Relative Maturity. Soybean varieties are affected by day length throughout the growing season. Day length triggers soybean plants to produce seed during the summer and to mature in the fall. Soybean varieties are assigned a relative maturity number (e.g. 2.5), which reflects differences in amount of time it takes individual varieties to reach physiological maturity. For example, a grower can chose a 2.5 RM variety and it will mature on average 4 days later than a 2.1 RM variety. Having a variety of a longer life cycle may improve yields, but it can expose the crop to more risk towards the end of the season if an early frost occurs.
REPNO – Replication number. Soybean yield experiments are typically replicated to account for field variability independent from farming practices and genetics. In other words, data from and individual replicates happen within an EXPERIMENT within a LOCATION.
YIELD – The amount of grain per unit of land that a soybean variety produces. Grain yield in soybeans in the United States is measured in bushels per acre. CLASS_OF – The final year that a soybean variety is tested prior to commercialization.
GENETIC INFORMATION
In addition of VARIETY, FAMILY, RM and CLASS_OF variables, the dataset contains genetic information in the form of 2163 genetic markers. These markers are characterized by single nucleotide polymorphisms (SNP). A SNP is a single base-pair difference in the DNA sequence of unique VARIETY.
MARKER ID 1 to 6062 for a total of 2163 markers:
The SNP information is for each of these markers are represented by 2163 individual columns. Each row show different nucleotide combinations across markers for a unique VARIETY. The letters represent the nucleotides adenine (A), cytosine (C), guanine (G) and tyrosine (T). The letter N represent no data. Genetic information is duplicated since soybeans are diploid organisms. As a result pairs can be homozygous (AA, CC, GG and TT) or heterozygous (AC, AG, AT and CG).
GEOGRAPHIC INFORMATION – Experiments are grown in trials at many testing sites, depending on the stage of testing. Individual varieties may respond differently to different sets of environmental conditions. One of the reasons that varieties are tested over multiple years is to see how varieties will respond to variance in weather and soil conditions.
LATITUDE & LONGITUDE – Indicate the geographic coordinates where a trial was placed in the Experiment dataset. In the Region dataset, they indicate the site where weather and soil characteristics were estimated.
FIPS – The FIPS county code is a five-digit Federal Information Processing Standard (FIPS) code which uniquely identifies counties and county equivalents in the United States. The first two digits indicate state and the last three the county.
AREA – The number of acres growing soybeans in the segment of about 36 sq miles around the testing location. The information was obtained from http://nassgeodata.gmu.edu/CropScape (NASS USDA, 2014)
IRRIGATION – The number of acres with irrigation in the segment of about 36 sq miles around the testing location. The information was obtained from http://nassgeodata.gmu.edu/CropScape (NASS USDA, 2014)
Temperature listed as TEMP_YEAR – The sum of the daily temperatures in degree Celsius between April 1st and October 31st in the corresponding year and location. The source of this information is the European Centre of Medium Range Weather Forecasts (ECMWF).
Precipitation listed as PREC_YEAR – The sum of the daily precipitation in millimeters between April 1st and October 31st in the corresponding year and location. The source of this information is European Centre of Medium Range Weather Forecasts (ECMWF).
Solar radiation listed as RAD_YEAR – The sum of the daily solar radiation in Watts per square meter between April 1st and October 31st in the corresponding year and location. The source of this information is European Centre of Medium Range Weather Forecasts (ECMWF).
CEC – The Cation Exchange Capacity (cmol kg-1) quantifies the amount of negative charge in the soil. It impacts soil chemical reactions and the ability of the soil to supply nutrient to plants. It is often associated with clay and organic matter content. This information was summarized for the first 30 cm of the soil profile. More information is available at www.soilgrids.org (Hengl et al., 2016 in review).
PH – The log of H+ concentration in the soil. Acidic soils have low pH values and high H+ concentration and alkaline soils have high pH values. It impacts soil chemical reactions and the ability of the soil to supply nutrient to plants. Optimum pH range is between 6.5 and 7. This information was summarized for the first 30 cm of the soil profile. More information is available at www.soilgrids.org (Hengl et al., 2016 in review).
ORGANIC MATTER – The percentage of the soil consisting of plant and animal residues at various stages of decomposition, soil organisms and their byproducts. It impacts soil chemical reactions and soil structure. It is an important indicator of the ability of the soil to supply nutrient and water to crops. This information was summarized for the first 30 cm of the soil profile. More information is available at www.soilgrids.org (Hengl et al., 2016 in review).
AWC_100cm – The available soil water capacity (volumetric fraction) until wilting point. This information was summarized for the first 100 cm. More information is available at www.soilgrids.org (Hodnett and Tomasella, 2002).
Soil CLAY, SILT and SAND – They are the percentages of soil particles according to size (small, less than 0.002 mm; medium, between 0.002 and 0.05 mm; and large, more than 0.05 mm, respectively). These proportions define soil texture. This information was summarized for the first 30 cm. More information is available at www.soilgrids.org (Hengl et al., 2016 in review).
References
Hengl, T., Mendes de Jesus, J., Heuvelink, G. B.M., Ruiperez Gonzalez, M., Kilibarda, M. et al. (2016) SoilGrids250m: global gridded soil information based on Machine Learning. PLOS One, in review.
Hodnett M.G, and J. Tomasella. 2002. Marked differences between van Genuchten soil water-retention parameters for temperate and tropical soils: A new water-retention pedo-transfer functions developed for tropical soils. Geoderma, 108 (3–4) (2002), pp. 155–180 http://dx.doi.org/10.1016/S0016-7061(02)00105-2.
USDA National Agricultural Statistics Service Cropland Data Layer. 2014. Published crop-specific data layer. https://nassgeodata.gmu.edu/CropScape/ (accessed 2014; verified August 5th 2016). USDA-NASS, Washington, DC.